Opinion polling for the Greek legislative election, January 2015
In the run up to the Greek legislative election of January 2015, various organisations carry out opinion polling to gauge voting intention in Greece. Results of such polls are displayed in this article.
The date range for these opinion polls are from the previous general election, held on 17 June 2012, to the day the next election was held, on 25 January 2015.
Election polling
Vote
- Graphical summary
-

Graph of polling from the June 2012 election to the January 2015 election, showing 15-day average trend lines
-

Graph of polling from the June 2012 election to the January 2015 election, showing 8-poll moving average trend lines
- Poll results
Poll results are listed in the table below in reverse chronological order, showing the most recent first, and using the date the survey's fieldwork was done, as opposed to the date of publication. If such date is unknown, the date of publication is given instead. The highest percentage figure in each polling survey is displayed in bold, and the background shaded in the leading party's colour. In the instance that there is a tie, then no figure is shaded. The lead column on the right shows the percentage-point difference between the two parties with the highest figures. When a specific poll does not show a data figure for a party, the party's cell corresponding to that poll is shown empty. The threshold for a party to elect members is 3%.
| Date | Polling Firm/Source | ND | SYRIZA | PASOK | ANEL | XA | DIMAR | KKE | Potami | KIDISO | Oth. | Lead |
|---|---|---|---|---|---|---|---|---|---|---|---|---|
| 25 Jan 2015 | Legislative Election | 27.8 | 36.3 | 4.7 | 4.8 | 6.3 | 0.5 | 5.5 | 6.0 | 2.5 | 5.6 | 8.5 |
| 25 Jan (21:30) | Singular Logic | 27.7 | 36.5 | 4.8 | 4.7 | 6.3 | 5.6 | 5.9 | 2.4 | 6.1 | 8.8 | |
| 25 Jan (20:45) | Public Issue | 27.8 | 36.6 | 4.8 | 4.7 | 6.2 | 5.6 | 5.8 | 2.6 | 5.9 | 8.8 | |
| 25 Jan (20:30) | Joint exit poll[lower-alpha 1][lower-alpha 2] | 27.0 | 37.0 | 4.7 | 4.5 | 6.5 | 0.5 | 5.5 | 6.5 | 2.7 | 5.1 | 10.0 |
| 25 Jan (19:00) | Interview | 28.0 | 37.0 | 4.0 | 5.0 | 6.0 | 1.0 | 5.0 | 7.5 | 2.0 | 4.5 | 9.0 |
| 25 Jan (19:00) | Palmos Analysis[lower-alpha 1] | 25.8 | 38.5 | 4.0 | 4.6 | 6.8 | 5.3 | 6.6 | 2.5 | 5.9 | 12.7 | |
| 25 Jan (19:00) | PAMAK[lower-alpha 1] | 25.5 | 37.5 | 5.0 | 3.5 | 7.0 | 6.0 | 7.5 | 2.5 | 5.5 | 12.0 | |
| 25 Jan (19:00) | Joint exit poll[lower-alpha 1][lower-alpha 2] | 25.0 | 37.5 | 4.7 | 4.0 | 7.2 | 0.5 | 5.2 | 7.2 | 2.7 | 6.0 | 12.5 |
| 25 Jan (19:00) | Pulse RC[lower-alpha 1] | 27.5 | 37.5 | 5.5 | 4.0 | 6.0 | 5.0 | 6.5 | 3.0 | 5.0 | 10.0 | |
| 25 Jan (19:00) | Kapa Research[lower-alpha 1] | 26.5 | 35.5 | 5.0 | 4.0 | 6.5 | 5.5 | 6.0 | 2.7 | 8.3 | 9.0 | |
| 25 Jan | Banking News[lower-alpha 1] | 25.5 | 37.5 | 5.5 | 3.5 | 6.9 | 5.5 | 6.6 | 2.6 | 6.4 | 12.0 | |
| 25 Jan | RIA Novosti[lower-alpha 1] | 26.6 | 34.5 | 4.5 | 4.3 | 6.4 | 5.0 | 6.2 | 2.9 | 9.6 | 7.9 | |
| Exit polls | ||||||||||||
| 23 Jan | GPO[lower-alpha 3] | 29.6 | 37.0 | 5.5 | 3.9 | 5.6 | 5.4 | 5.5 | 3.2 | 4.3 | 7.4 | |
| 23 Jan | MRB[lower-alpha 3] | 30.0 | 35.9 | 4.6 | 3.7 | 6.3 | 5.2 | 7.5 | 2.8 | 4.0 | 5.9 | |
| 22–23 Jan | Interview[lower-alpha 3] | 29.9 | 36.6 | 4.7 | 2.7 | 6.7 | 1.1 | 4.7 | 6.1 | 1.9 | 5.6 | 6.7 |
| 22–23 Jan | Kapa Research[lower-alpha 3] | 32.3 | 35.5 | 5.3 | 2.9 | 6.1 | 5.0 | 5.5 | 2.8 | 4.6 | 3.2 | |
| 21–23 Jan | PAMAK[lower-alpha 3][lower-alpha 4] | 28.5 | 36.0 | 5.5 | 4.0 | 6.5 | 0.5 | 6.0 | 7.5 | 1.5 | 4.0 | 7.5 |
| 21–23 Jan | Alco[lower-alpha 3] | 30.0 | 37.6 | 5.1 | 4.1 | 6.2 | 1.1 | 4.2 | 6.2 | 2.6 | 2.9 | 7.6 |
| 21–23 Jan | Palmos Analysis | 25.5 | 36.5 | 4.5 | 4.0 | 6.5 | 6.0 | 7.5 | 9.5 | 11.0 | ||
| 20–23 Jan | Public Issue | 29.0 | 35.0 | 5.0 | 3.5 | 6.5 | 0.5 | 6.0 | 7.5 | 2.5 | 4.5 | 6.0 |
| 19–23 Jan | Metron Analysis | 30.0 | 36.5 | 4.5 | 3.5 | 6.0 | 5.0 | 7.0 | 2.5 | 5.0 | 6.5 | |
| 21–22 Jan | Pulse RC[lower-alpha 3][lower-alpha 4] | 30.5 | 36.0 | 6.0 | 4.0 | 6.5 | 5.0 | 7.0 | 3.0 | 2.0 | 5.5 | |
| 20–22 Jan | GPO[lower-alpha 3] | 29.6 | 36.3 | 4.9 | 3.8 | 5.6 | 1.1 | 5.6 | 6.5 | 3.3 | 3.3 | 6.7 |
| 19–22 Jan | Palmos Analysis | 26.0 | 36.0 | 4.5 | 3.5 | 7.5 | 5.5 | 7.5 | 9.5 | 10.0 | ||
| 17–22 Jan | E.Panas[lower-alpha 3] | 31.0 | 33.9 | 6.0 | 4.3 | 6.1 | 0.6 | 5.0 | 5.8 | 3.0 | 4.3 | 2.9 |
| 20–21 Jan | Rass[lower-alpha 3] | 29.2 | 34.5 | 4.7 | 4.2 | 5.6 | 5.9 | 7.0 | 2.8 | 6.1 | 5.3 | |
| 19–21 Jan | Marc | 28.7 | 36.8 | 4.4 | 3.4 | 6.9 | 1.1 | 4.9 | 7.0 | 2.6 | 4.2 | 8.1 |
| 19–21 Jan | Metron Analysis | 30.7 | 36.0 | 4.0 | 4.2 | 5.4 | 4.9 | 7.2 | 1.6 | 6.0 | 5.3 | |
| 19–21 Jan | Metrisi[lower-alpha 3] | 32.5 | 34.7 | 5.3 | 2.9 | 5.8 | 0.8 | 4.6 | 5.7 | 2.6 | 5.1 | 2.2 |
| 16–21 Jan | Public Issue | 30.0 | 35.0 | 5.5 | 3.5 | 6.5 | 0.5 | 6.0 | 7.0 | 2.5 | 3.5 | 5.0 |
| 19–20 Jan | ProRata[lower-alpha 3][lower-alpha 4] | 27.5 | 36.0 | 5.5 | 4.0 | 6.5 | 0.5 | 6.0 | 7.5 | 2.0 | 4.5 | 8.5 |
| 19–20 Jan | Pulse RC[lower-alpha 3][lower-alpha 4] | 30.5 | 35.0 | 6.0 | 3.5 | 6.5 | 5.0 | 7.0 | 3.0 | 3.5 | 4.5 | |
| 19–20 Jan | Rass[lower-alpha 3] | 30.3 | 35.1 | 4.5 | 3.5 | 5.1 | 6.2 | 7.1 | 2.5 | 5.7 | 4.8 | |
| 18–20 Jan | E-Voice[lower-alpha 3] | 29.6 | 33.3 | 5.1 | 4.3 | 6.1 | 6.0 | 6.1 | 2.9 | 6.6 | 3.7 | |
| 18–20 Jan | Alco[lower-alpha 3] | 31.4 | 37.1 | 4.6 | 3.5 | 5.3 | 1.2 | 4.8 | 6.5 | 2.3 | 3.3 | 5.7 |
| 17–18 Jan | GPO[lower-alpha 3] | 30.1 | 34.7 | 5.8 | 3.4 | 5.9 | 1.1 | 5.5 | 5.9 | 2.9 | 4.7 | 4.6 |
| 17–18 Jan | PAMAK[lower-alpha 3][lower-alpha 4] | 29.5 | 36.5 | 5.0 | 3.5 | 6.0 | 0.5 | 6.0 | 8.0 | 1.5 | 3.5 | 7.0 |
| 16–18 Jan | Metrisi[lower-alpha 3] | 32.7 | 35.1 | 4.8 | 2.4 | 5.5 | 0.8 | 4.8 | 6.1 | 2.7 | 5.1 | 2.4 |
| 17 Jan | E-Voice[lower-alpha 3] | 30.6 | 33.9 | 4.5 | 4.2 | 6.4 | 5.6 | 5.5 | 2.8 | 6.5 | 3.3 | |
| 15–17 Jan | Alco[lower-alpha 3] | 32.0 | 37.2 | 4.8 | 3.8 | 5.6 | 4.8 | 6.0 | 2.6 | 3.2 | 5.2 | |
| 16 Jan | Metron Analysis | 30.8 | 35.4 | 4.2 | 3.0 | 5.4 | 5.1 | 7.1 | 2.7 | 6.3 | 4.6 | |
| 14–15 Jan | To the Point[lower-alpha 3] | 30.6 | 34.6 | 6.5 | 3.0 | 6.6 | 6.5 | 7.0 | 2.3 | 2.9 | 4.0 | |
| 14–15 Jan | Rass[lower-alpha 3] | 30.2 | 34.7 | 4.9 | 4.1 | 5.9 | 6.1 | 7.1 | 2.5 | 4.5 | 4.5 | |
| 14–15 Jan | Interview[lower-alpha 3] | 33.0 | 35.2 | 4.1 | 2.1 | 5.8 | 0.8 | 4.7 | 5.9 | 2.3 | 6.1 | 2.2 |
| 13–15 Jan | Kapa Research[lower-alpha 3] | 31.8 | 35.3 | 5.7 | 3.1 | 5.3 | 5.5 | 6.1 | 3.1 | 4.1 | 3.5 | |
| 12–15 Jan | Palmos Analysis | 29.0 | 34.5 | 4.0 | 3.0 | 6.5 | 5.5 | 9.0 | 8.5 | 5.5 | ||
| 10–15 Jan | Public Issue | 30.5 | 35.5 | 5.0 | 3.0 | 6.5 | 1.5 | 7.0 | 7.0 | 2.0 | 2.0 | 5.0 |
| 13–14 Jan | Pulse RC[lower-alpha 3][lower-alpha 4] | 31.0 | 34.5 | 6.5 | 3.5 | 6.5 | 5.0 | 7.0 | 3.0 | 3.0 | 3.5 | |
| 5–14 Jan | E.Panas[lower-alpha 3] | 28.6 | 33.4 | 6.4 | 3.8 | 5.5 | 0.4 | 5.8 | 6.7 | 3.1 | 6.3 | 4.8 |
| 12–13 Jan | Metrisi[lower-alpha 3] | 31.8 | 34.3 | 4.7 | 2.3 | 5.2 | 1.2 | 5.0 | 6.1 | 3.1 | 6.3 | 2.5 |
| 11–13 Jan | Alco[lower-alpha 3] | 32.4 | 36.4 | 4.2 | 3.0 | 5.8 | 4.7 | 5.9 | 2.8 | 4.8 | 4.0 | |
| 11–12 Jan | Rass[lower-alpha 3] | 32.1 | 35.6 | 4.2 | 3.2 | 5.7 | 5.2 | 6.8 | 2.7 | 4.5 | 3.5 | |
| 10–12 Jan | PAMAK[lower-alpha 3][lower-alpha 4] | 29.5 | 34.5 | 3.5 | 3.5 | 6.5 | 0.5 | 6.5 | 7.0 | 2.0 | 6.5 | 5.0 |
| 9–11 Jan | Interview[lower-alpha 1] | 32.2 | 34.5 | 5.0 | 1.8 | 6.2 | 0.2 | 4.9 | 6.5 | 2.0 | 6.7 | 2.3 |
| 7–9 Jan | Data RC | 29.5 | 35.3 | 4.1 | 2.7 | 5.2 | 6.0 | 7.1 | 2.6 | 7.5 | 5.8 | |
| 7–9 Jan | Alco[lower-alpha 3] | 33.1 | 36.9 | 4.7 | 2.6 | 5.0 | 4.4 | 5.3 | 2.8 | 5.2 | 3.8 | |
| 7–9 Jan | Metrisi[lower-alpha 3] | 31.6 | 34.4 | 5.5 | 2.5 | 5.9 | 1.4 | 5.2 | 5.8 | 3.3 | 4.4 | 2.8 |
| 6–9 Jan | Pulse RC[lower-alpha 3][lower-alpha 4] | 30.0 | 34.0 | 6.5 | 3.5 | 6.5 | 5.5 | 6.5 | 3.0 | 4.5 | 4.0 | |
| 2–9 Jan | Public Issue | 30.0 | 38.0 | 5.5 | 3.0 | 5.5 | 1.0 | 5.0 | 7.0 | 1.5 | 3.5 | 8.0 |
| 7–8 Jan | E-Voice[lower-alpha 3] | 31.1 | 34.8 | 4.4 | 1.9 | 5.2 | 5.9 | 5.7 | 2.2 | 8.8 | 3.7 | |
| 7–8 Jan | Kapa Research[lower-alpha 3] | 29.9 | 33.0 | 6.1 | 3.1 | 6.3 | 5.9 | 7.6 | 3.3 | 4.8 | 3.1 | |
| 7–8 Jan | Rass[lower-alpha 3] | 32.3 | 35.5 | 4.0 | 3.0 | 6.2 | 5.7 | 6.0 | 2.6 | 4.7 | 3.2 | |
| 5–8 Jan | MRB | 30.1 | 33.7 | 5.5 | 3.1 | 5.4 | 1.1 | 5.7 | 6.8 | 2.9 | 5.7 | 3.6 |
| 5–8 Jan | Metron Analysis | 30.0 | 34.1 | 4.1 | 3.5 | 5.6 | 5.3 | 8.4 | 2.8 | 6.2 | 4.1 | |
| 5–8 Jan | Marc[lower-alpha 3] | 30.3 | 33.9 | 4.4 | 3.1 | 6.3 | 5.7 | 6.4 | 3.0 | 6.9 | 3.6 | |
| 5–8 Jan | Palmos Analysis | 28.0 | 34.0 | 3.5 | 3.0 | 7.5 | 5.5 | 7.5 | 11.0 | 6.0 | ||
| 5–7 Jan | GPO[lower-alpha 3] | 29.4 | 33.1 | 5.8 | 3.1 | 6.3 | 6.6 | 6.7 | 3.0 | 6.0 | 3.7 | |
| 4–7 Jan | ProRata[lower-alpha 3][lower-alpha 4] | 31.0 | 37.5 | 3.5 | 2.5 | 5.5 | 0.0 | 6.5 | 6.5 | 2.0 | 5.0 | 6.5 |
| 5–6 Jan | Pulse RC[lower-alpha 3][lower-alpha 4] | 30.0 | 34.0 | 6.5 | 3.5 | 6.5 | 6.0 | 6.5 | 3.0 | 4.0 | 4.0 | |
| 5–6 Jan | Interview[lower-alpha 3] | 30.5 | 32.9 | 4.4 | 2.1 | 6.9 | 0.2 | 5.6 | 7.6 | 2.5 | 7.3 | 2.4 |
| 4–6 Jan | Alco[lower-alpha 3] | 34.1 | 37.7 | 4.3 | 2.6 | 4.9 | 4.5 | 5.0 | 3.0 | 3.9 | 3.6 | |
| 30 Dec–3 Jan | Palmos Analysis | 28.0 | 35.5 | 4.0 | 4.0 | 6.5 | 5.5 | 6.5 | 10.0 | 7.5 | ||
| 1–2 Jan | E-Voice[lower-alpha 3] | 30.1 | 34.1 | 4.3 | 3.3 | 5.3 | 5.5 | 6.8 | 10.6 | 4.0 | ||
| 2015 | ||||||||||||
| 30–31 Dec | Interview[lower-alpha 3] | 30.5 | 33.3 | 6.0 | 2.4 | 6.1 | 0.9 | 6.1 | 6.1 | 8.6 | 2.8 | |
| 29–30 Dec | Rass[lower-alpha 3] | 33.2 | 37.0 | 4.3 | 3.0 | 4.6 | 5.8 | 5.7 | 6.4 | 3.8 | ||
| 28–30 Dec | PAMAK[lower-alpha 3][lower-alpha 4] | 29.5 | 34.5 | 4.5 | 2.5 | 7.0 | 0.5 | 6.0 | 6.0 | 9.5 | 5.0 | |
| 26–28 Dec | Marc[lower-alpha 3] | 28.9 | 32.3 | 5.3 | 3.5 | 6.8 | 1.2 | 6.2 | 7.0 | 8.8 | 3.4 | |
| 26–28 Dec | Palmos Analysis | 29.0 | 35.0 | 4.5 | 3.5 | 7.0 | 5.0 | 9.5 | 6.5 | 6.0 | ||
| 26–27 Dec | Interview[lower-alpha 3] | 29.1 | 32.0 | 6.4 | 2.4 | 6.8 | 0.7 | 6.5 | 5.5 | 10.6 | 2.9 | |
| 23–24 Dec | Kapa Research[lower-alpha 3] | 30.3 | 33.3 | 7.5 | 3.1 | 6.7 | 7.1 | 7.1 | 4.9 | 3.0 | ||
| 20–23 Dec | Marc[lower-alpha 3] | 27.9 | 31.9 | 5.1 | 3.7 | 6.4 | 1.4 | 6.0 | 6.5 | 11.1 | 4.0 | |
| 19–22 Dec | Palmos Analysis | 27.5 | 32.5 | 5.0 | 4.5 | 6.0 | 6.0 | 7.5 | 11.0 | 5.0 | ||
| 18–22 Dec | Alco[lower-alpha 3] | 30.9 | 35.0 | 5.7 | 3.7 | 6.4 | 5.2 | 5.4 | 7.7 | 4.1 | ||
| 19–21 Dec | Pulse RC[lower-alpha 3][lower-alpha 4] | 29.5 | 33.5 | 7.5 | 4.0 | 6.5 | 6.0 | 6.5 | 6.5 | 4.0 | ||
| 14–21 Dec | Patris News[lower-alpha 3] | 24.4 | 32.2 | 8.7 | 4.2 | 10.8 | 0.9 | 4.6 | 5.3 | 8.9 | 7.8 | |
| 18–20 Dec | Interview[lower-alpha 3] | 30.3 | 33.3 | 6.2 | 2.2 | 5.5 | 1.1 | 6.3 | 5.5 | 9.6 | 3.0 | |
| 17–18 Dec | Rass[lower-alpha 3] | 29.3 | 33.5 | 5.7 | 3.5 | 5.4 | 6.5 | 7.2 | 8.9 | 4.2 | ||
| 17 Dec | Marc[lower-alpha 3] | 28.4 | 32.5 | 5.5 | 3.4 | 6.6 | 1.6 | 6.4 | 6.4 | 9.2 | 4.1 | |
| 15–17 Dec | PAMAK[lower-alpha 3][lower-alpha 4] | 28.0 | 35.0 | 5.5 | 3.5 | 7.0 | 0.5 | 5.5 | 7.5 | 7.5 | 7.0 | |
| 10–17 Dec | Public Issue | 29.5 | 36.5 | 6.0 | 3.5 | 6.0 | 1.0 | 6.0 | 8.5 | 3.0 | 7.0 | |
| 14–16 Dec | Palmos Analysis | 27.0 | 34.5 | 4.5 | 5.0 | 6.5 | 6.0 | 6.5 | 10.0 | 7.5 | ||
| 11–15 Dec | GPO[lower-alpha 3] | 27.8 | 33.7 | 6.1 | 3.3 | 6.0 | 6.6 | 6.1 | 10.2 | 5.9 | ||
| 11–14 Dec | V-Politis[lower-alpha 3] | 29.0 | 33.7 | 4.5 | 3.5 | 8.8 | 1.5 | 7.1 | 6.1 | 0.5 | 5.4 | 4.7 |
| 12–13 Dec | Pulse RC[lower-alpha 3][lower-alpha 4] | 28.5 | 32.5 | 8.5 | 4.0 | 7.0 | 6.0 | 6.5 | Did not exist | 7.0 | 4.0 | |
| 10–13 Dec | MRB | 26.7 | 30.8 | 7.0 | 3.6 | 5.7 | 1.9 | 6.4 | 7.3 | 10.6 | 4.1 | |
| 11–12 Dec | Interview[lower-alpha 3] | 30.5 | 34.0 | 6.5 | 2.6 | 4.6 | 1.5 | 5.5 | 4.9 | 9.8 | 3.5 | |
| 9–12 Dec | Alco[lower-alpha 3] | 30.3 | 34.8 | 6.3 | 3.7 | 7.1 | 5.5 | 5.2 | 7.1 | 4.5 | ||
| 10–11 Dec | Kapa Research[lower-alpha 3] | 28.4 | 32.0 | 8.4 | 3.4 | 7.4 | 7.3 | 7.5 | 5.6 | 3.6 | ||
| 9–10 Dec | Interview[lower-alpha 3] | 30.5 | 34.2 | 5.7 | 2.1 | 5.2 | 0.8 | 6.7 | 5.4 | 9.4 | 3.7 | |
| 8–10 Dec | Metron Analysis | 28.6 | 32.8 | 5.8 | 3.4 | 5.6 | 5.6 | 9.2 | 9.0 | 4.2 | ||
| 3–10 Dec | MRB | 25.9 | 31.0 | 6.6 | 3.8 | 6.4 | 1.5 | 6.5 | 7.6 | 10.7 | 5.1 | |
| 8–9 Dec | Alco[lower-alpha 3] | 29.6 | 35.7 | 6.0 | 4.2 | 6.9 | 5.5 | 5.5 | 6.6 | 6.1 | ||
| 5–6 Dec | Pulse RC[lower-alpha 3][lower-alpha 4] | 26.5 | 32.5 | 8.0 | 4.0 | 7.5 | 1.0 | 6.5 | 7.5 | 6.0 | 6.0 | |
| 4–5 Dec | Interview[lower-alpha 3] | 30.4 | 34.0 | 6.5 | 2.6 | 4.6 | 1.7 | 5.5 | 4.9 | 9.8 | 3.6 | |
| 1–3 Dec | Metron Analysis | 27.8 | 34.0 | 5.4 | 3.8 | 7.0 | 5.6 | 9.7 | 6.7 | 6.2 | ||
| 28–29 Nov | Pulse RC[lower-alpha 3][lower-alpha 4] | 27.0 | 32.5 | 8.0 | 4.0 | 7.0 | 1.0 | 6.5 | 7.5 | 6.0 | 5.5 | |
| 24–27 Nov | Palmos Analysis | 23.0 | 34.5 | 5.0 | 4.5 | 8.0 | 0.5 | 6.5 | 8.0 | 10.0 | 11.5 | |
| 24–26 Nov | Metron Analysis | 28.2 | 33.1 | 6.4 | 3.7 | 6.1 | 1.3 | 6.6 | 7.5 | 7.1 | 4.9 | |
| 21–24 Nov | PAMAK[lower-alpha 3][lower-alpha 4] | 24.0 | 33.0 | 4.0 | 3.5 | 8.0 | 1.0 | 6.5 | 7.0 | 13.0 | 9.0 | |
| 21–22 Nov | Pulse RC[lower-alpha 3][lower-alpha 4] | 26.0 | 32.0 | 8.0 | 4.0 | 7.5 | 1.0 | 7.0 | 7.0 | 7.5 | 6.0 | |
| 18–19 Nov | Kapa Research[lower-alpha 3] | 27.3 | 31.8 | 8.4 | 3.9 | 7.5 | 7.3 | 8.1 | 5.7 | 4.5 | ||
| 17–19 Nov | MRB | 25.1 | 30.6 | 5.1 | 4.0 | 6.3 | 1.4 | 6.4 | 9.6 | 11.5 | 5.5 | |
| 17–19 Nov | Metron Analysis | 26.3 | 32.9 | 5.2 | 4.0 | 5.0 | 6.2 | 8.3 | 12.1 | 6.6 | ||
| 10–17 Nov | Public Issue | 27.0 | 38.5 | 5.0 | 3.0 | 6.0 | 1.0 | 6.5 | 8.5 | 4.5 | 11.5 | |
| 10–12 Nov | Metron Analysis | 26.5 | 31.3 | 5.3 | 3.8 | 5.8 | 1.6 | 6.1 | 10.0 | 9.6 | 4.8 | |
| 5–6 Nov | Interview[lower-alpha 3] | 30.0 | 33.3 | 5.9 | 3.5 | 4.1 | 1.5 | 5.2 | 5.8 | 10.7 | 3.3 | |
| 3–5 Nov | Metron Analysis | 26.5 | 32.6 | 5.1 | 4.8 | 5.9 | 5.3 | 10.3 | 9.5 | 6.1 | ||
| 31 Oct–3 Nov | Palmos Analysis | 23.5 | 35.0 | 5.5 | 4.0 | 8.0 | 1.0 | 5.5 | 7.0 | 10.5 | 11.5 | |
| 29–31 Oct | Rass[lower-alpha 3] | 26.8 | 33.5 | 5.2 | 3.8 | 6.5 | 1.3 | 6.9 | 7.4 | 8.6 | 6.7 | |
| 29–30 Oct | Metrisi[lower-alpha 3] | 28.3 | 32.0 | 6.2 | 2.7 | 7.5 | 1.1 | 6.3 | 6.5 | 9.4 | 3.7 | |
| 21–23 Oct | Alco[lower-alpha 3] | 29.8 | 35.4 | 5.1 | 3.7 | 6.9 | 5.5 | 5.7 | 7.9 | 5.6 | ||
| 17–21 Oct | Pulse RC[lower-alpha 3][lower-alpha 4] | 26.5 | 32.5 | 8.0 | 3.5 | 8.5 | 2.0 | 6.5 | 7.0 | 5.5 | 6.0 | |
| 13–20 Oct | Public Issue | 27.0 | 35.5 | 6.0 | 3.0 | 6.0 | 1.0 | 6.5 | 10.5 | 4.5 | 8.5 | |
| 18 Oct | PAMAK[lower-alpha 3][lower-alpha 4] | 24.0 | 33.0 | 5.0 | 3.0 | 8.0 | 0.5 | 6.5 | 9.0 | 11.0 | 9.0 | |
| 13–15 Oct | Kapa Research[lower-alpha 3] | 27.5 | 32.1 | 6.8 | 4.5 | 7.5 | 1.3 | 6.2 | 6.6 | 7.5 | 4.6 | |
| 13–15 Oct | Metron Analysis | 26.1 | 32.9 | 4.7 | 4.7 | 6.3 | 6.8 | 8.5 | 10.0 | 6.8 | ||
| 9–13 Oct | GPO[lower-alpha 3] | 25.3 | 33.5 | 5.0 | 3.8 | 7.2 | 7.2 | 7.5 | 10.5 | 8.2 | ||
| 8–10 Oct | Metrisi[lower-alpha 3] | 28.9 | 32.6 | 6.5 | 2.9 | 8.2 | 1.1 | 6.5 | 5.5 | 7.8 | 3.7 | |
| 6–8 Oct | Metron Analysis | 26.2 | 34.1 | 4.6 | 3.3 | 7.0 | 1.3 | 5.3 | 9.1 | 9.1 | 7.9 | |
| 4–8 Oct | Palmos Analysis | 25.0 | 35.5 | 6.5 | 3.0 | 6.0 | 1.0 | 5.0 | 7.5 | 10.5 | 10.5 | |
| 27 Sep–4 Oct | UoA[lower-alpha 3] | 23.7 | 34.1 | 6.8 | 3.3 | 10.5 | 0.8 | 6.4 | 7.4 | 7.0 | 10.4 | |
| 29 Sep–2 Oct | E-Voice[lower-alpha 3] | 25.3 | 30.7 | 5.6 | 2.9 | 7.7 | 1.2 | 6.4 | 6.7 | 13.5 | 5.4 | |
| 15–23 Sep | Public Issue | 25.0 | 36.0 | 5.5 | 4.0 | 7.5 | 1.0 | 6.5 | 9.5 | 5.0 | 11.0 | |
| 16–18 Sep | Rass[lower-alpha 3] | 27.8 | 32.6 | 5.3 | 4.0 | 8.5 | 1.3 | 7.0 | 5.9 | 7.6 | 4.8 | |
| 16–18 Sep | MRB | 25.3 | 30.0 | 5.3 | 4.1 | 8.5 | 1.3 | 6.5 | 7.1 | 11.8 | 4.7 | |
| 16–18 Sep | Alco[lower-alpha 3] | 28.2 | 33.2 | 5.5 | 3.9 | 7.9 | 2.1 | 5.6 | 5.5 | 8.1 | 5.0 | |
| 11–15 Sep | PAMAK[lower-alpha 3][lower-alpha 4] | 23.0 | 30.5 | 7.0 | 4.0 | 8.0 | 1.5 | 7.0 | 7.0 | 12.0 | 7.5 | |
| 8–10 Sep | Metron Analysis[lower-alpha 3] | 27.4 | 31.0 | 6.2 | 4.0 | 7.1 | 7.5 | 6.4 | 10.4 | 3.6 | ||
| 2–4 Sep | E-Voice[lower-alpha 3] | 25.0 | 28.6 | 6.8 | 3.4 | 10.0 | 1.8 | 9.2 | 5.5 | 9.7 | 3.6 | |
| 1–3 Sep | Alco[lower-alpha 3] | 27.8 | 32.4 | 5.5 | 4.5 | 9.4 | 2.9 | 5.9 | 4.7 | 6.9 | 4.6 | |
| 25–28 Aug | Palmos Analysis | 25.0 | 35.0 | 4.5 | 4.0 | 11.5 | 1.5 | 5.0 | 3.5 | 10.0 | 10.0 | |
| 15–16 Jul | Pulse RC[lower-alpha 3][lower-alpha 4] | 24.5 | 28.0 | 8.0 | 4.0 | 10.5 | 2.0 | 6.5 | 8.0 | 7.5 | 3.5 | |
| 1–9 Jul | Public Issue | 24.0 | 31.0 | 7.5 | 4.5 | 8.5 | 1.5 | 6.5 | 10.5 | 6.0 | 7.0 | |
| 25 Jun–4 Jul | MRB | 24.7 | 26.8 | 7.9 | 4.7 | 10.6 | 1.6 | 6.4 | 8.4 | 8.9 | 2.1 | |
| 9–11 Jun | Metron Analysis | 24.9 | 27.9 | 8.7 | 38.5 | 3.0 | ||||||
| 3–11 Jun | Public Issue | 25.0 | 34.0 | 7.0 | 3.5 | 10.0 | 1.5 | 6.5 | 6.0 | 6.5 | 9.0 | |
| 25 May 2014 | EP Election | 22.7 | 26.6 | 8.0 | 3.5 | 9.4 | 1.2 | 6.1 | 6.6 | 15.9 | 3.9 | |
| 8–12 May | GPO[lower-alpha 3] | 28.3 | 26.7 | 6.8 | 4.6 | 8.0 | 3.2 | 8.3 | 8.1 | 6.0 | 1.6 | |
| 29 Apr–6 May | Public Issue | 29.0 | 29.0 | 6.0 | 3.5 | 8.5 | 3.5 | 7.5 | 5.5 | 7.5 | 0.0 | |
| 24 Apr–1 May | Palmos Analysis | 27.1 | 33.0 | 4.1 | 4.0 | 8.6 | 1.9 | 4.9 | 7.5 | 8.9 | 5.9 | |
| 28–30 Apr | Metron Analysis | 29.2 | 27.6 | 6.0 | 4.7 | 7.5 | 2.5 | 6.2 | 11.0 | 5.3 | 1.6 | |
| 23–25 Apr | Alco[lower-alpha 3] | 28.6 | 27.7 | 6.3 | 4.6 | 8.6 | 3.2 | 6.1 | 6.8 | 8.0 | 0.9 | |
| 8–11 Apr | MRB | 26.5 | 25.3 | 5.9 | 4.9 | 9.9 | 3.4 | 7.3 | 10.0 | 6.8 | 1.2 | |
| 8–9 Apr | Pulse RC[lower-alpha 3][lower-alpha 4] | 24.0 | 25.5 | 7.0 | 5.0 | 12.0 | 2.5 | 7.0 | 9.5 | 7.0 | 1.5 | |
| 1–8 Apr | Public Issue | 27.5 | 29.0 | 6.0 | 4.0 | 10.0 | 3.5 | 7.0 | 7.0 | 6.0 | 1.5 | |
| 3–5 Apr | GPO[lower-alpha 3] | 26.9 | 25.8 | 7.1 | 5.2 | 8.3 | 3.7 | 8.3 | 10.7 | 4.4 | 1.1 | |
| 3–4 Apr | PAMAK[lower-alpha 3][lower-alpha 4] | 23.5 | 26.0 | 6.0 | 3.5 | 9.0 | 2.5 | 9.0 | 10.5 | 10.0 | 2.5 | |
| 27 Mar–3 Apr | Metron Analysis | 25.1 | 26.5 | 5.8 | 3.7 | 7.9 | 3.2 | 6.1 | 14.2 | 7.5 | 1.4 | |
| 22–27 Mar | Palmos Analysis | 25.2 | 26.8 | 5.2 | 4.2 | 10.3 | 2.7 | 6.1 | 10.3 | 9.2 | 1.6 | |
| 17–18 Mar | Pulse RC[lower-alpha 3][lower-alpha 4] | 24.5 | 26.5 | 7.0 | 5.0 | 12.5 | 2.5 | 7.0 | 8.0 | 7.5 | 2.0 | |
| 11–13 Mar | Alco[lower-alpha 3] | 23.6 | 25.1 | 6.7 | 5.9 | 9.1 | 2.9 | 6.6 | 11.5 | 8.6 | 1.5 | |
| 4–10 Mar | Public Issue | 28.0 | 28.5 | 5.5 | 5.0 | 10.5 | 3.0 | 7.5 | 7.0 | 5.0 | 0.5 | |
| 27 Feb–4 Mar | Alco[lower-alpha 3] | 26.3 | 27.5 | 5.0 | 5.3 | 9.1 | 3.7 | 6.8 | 7.5 | 8.9 | 1.2 | |
| 24 Feb–1 Mar | Palmos Analysis | 26.8 | 33.4 | 4.7 | 4.7 | 13.4 | 2.5 | 5.1 | Did not exist | 9.7 | 6.6 | |
| 24–26 Feb | Metron Analysis | 28.5 | 29.2 | 6.4 | 5.9 | 9.7 | 4.7 | 8.7 | 6.9 | 0.7 | ||
| 5–11 Feb | Alco[lower-alpha 3] | 28.9 | 30.2 | 5.0 | 5.9 | 9.1 | 3.6 | 8.0 | 9.3 | 1.3 | ||
| 6–10 Feb | GPO[lower-alpha 3] | 26.5 | 28.1 | 7.4 | 5.8 | 9.5 | 5.0 | 8.0 | 9.7 | 1.6 | ||
| 3–7 Feb | Public Issue | 28.5 | 30.0 | 7.0 | 6.0 | 8.5 | 3.5 | 7.5 | 9.0 | 1.5 | ||
| 5 Feb | Marc[lower-alpha 3] | 27.0 | 29.8 | 6.7 | 5.9 | 10.0 | 5.5 | 6.7 | 8.6 | 2.8 | ||
| 4–5 Feb | Metrisi[lower-alpha 3] | 29.3 | 29.7 | 5.8 | 6.6 | 12.4 | 3.8 | 7.0 | 5.5 | 0.4 | ||
| 20–25 Jan | Palmos Analysis | 27.2 | 32.3 | 4.9 | 5.9 | 9.3 | 2.7 | 5.8 | 11.9 | 5.1 | ||
| 21–24 Jan | Alco[lower-alpha 3] | 28.2 | 29.0 | 6.1 | 5.6 | 10.1 | 4.2 | 6.0 | 10.7 | 0.8 | ||
| 20–22 Jan | Metron Analysis | 29.2 | 30.4 | 6.4 | 4.8 | 10.3 | 3.7 | 5.0 | 10.2 | 1.2 | ||
| 20–21 Jan | Pulse RC[lower-alpha 3][lower-alpha 4] | 25.5 | 29.0 | 7.0 | 5.5 | 13.5 | 3.5 | 6.0 | 10.0 | 3.5 | ||
| 8–13 Jan | Public Issue | 28.0 | 31.5 | 6.5 | 4.5 | 10.0 | 3.5 | 6.5 | 9.0 | 3.5 | ||
| 2014 | ||||||||||||
| 18–19 Dec | Kapa Research[lower-alpha 3] | 28.3 | 29.3 | 7.3 | 5.2 | 9.8 | 3.7 | 6.9 | Did not exist | Did not exist | 9.5 | 1.0 |
| 17–19 Dec | Rass[lower-alpha 3] | 29.7 | 30.2 | 5.6 | 5.9 | 7.6 | 4.3 | 7.9 | 9.0 | 0.5 | ||
| 13–19 Dec | Palmos Analysis | 24.4 | 31.0 | 6.3 | 6.4 | 9.1 | 5.6 | 6.5 | 10.8 | 6.6 | ||
| 16–18 Dec | Pulse RC[lower-alpha 3][lower-alpha 4] | 25.0 | 28.0 | 7.0 | 5.5 | 14.5 | 4.0 | 7.0 | 9.5 | 3.0 | ||
| 19 Nov–12 Dec | Metron Analysis | 28.5 | 30.2 | 6.5 | 6.9 | 10.3 | 3.9 | 5.5 | 8.2 | 1.7 | ||
| 2–11 Dec | MRB[lower-alpha 3] | 27.9 | 29.1 | 6.3 | 6.4 | 11.8 | 4.1 | 6.7 | 7.7 | 1.2 | ||
| 29 Nov–3 Dec | Pulse RC[lower-alpha 3][lower-alpha 4] | 25.0 | 28.5 | 8.0 | 5.0 | 14.5 | 3.0 | 7.5 | 8.0 | 3.5 | ||
| 28–30 Nov | GPO[lower-alpha 3] | 26.2 | 26.8 | 7.6 | 6.8 | 11.0 | 5.3 | 7.7 | 8.5 | 0.6 | ||
| 26–28 Nov | Kapa Research[lower-alpha 3] | 28.9 | 28.1 | 7.7 | 5.7 | 9.9 | 4.3 | 6.3 | 9.2 | 0.8 | ||
| 26–28 Nov | Metrisi[lower-alpha 3] | 31.0 | 29.7 | 6.2 | 5.9 | 8.8 | 2.3 | 7.1 | 9.1 | 1.3 | ||
| 19–25 Nov | Marc | 27.8 | 29.7 | 6.4 | 6.7 | 8.8 | 5.8 | 6.6 | 8.2 | 1.9 | ||
| 19–20 Nov | Metron Analysis | 29.2 | 29.9 | 6.0 | 5.9 | 10.0 | 3.7 | 5.9 | 9.4 | 0.7 | ||
| 12–16 Nov | Palmos Analysis | 26.5 | 30.5 | 7.5 | 6.4 | 11.0 | 3.5 | 6.0 | 8.7 | 4.0 | ||
| 12–15 Nov | Alco[lower-alpha 3] | 27.8 | 28.3 | 6.4 | 6.7 | 11.1 | 4.3 | 5.3 | 10.2 | 0.5 | ||
| 12–14 Nov | Rass[lower-alpha 3] | 30.9 | 28.9 | 5.9 | 6.1 | 7.9 | 4.0 | 7.4 | 8.8 | 2.0 | ||
| 6–12 Nov | Pulse RC[lower-alpha 3][lower-alpha 4] | 26.5 | 27.5 | 8.0 | 5.5 | 13.0 | 3.5 | 6.0 | 9.5 | 1.0 | ||
| 15–16 Oct | Metron Analysis | 30.3 | 28.9 | 7.1 | 6.4 | 7.6 | 3.6 | 5.9 | 10.3 | 1.4 | ||
| 14–16 Oct | Metrisi[lower-alpha 3] | 30.3 | 28.6 | 7.1 | 6.5 | 7.9 | 2.6 | 7.1 | 10.0 | 1.7 | ||
| 10–16 Oct | Pulse RC[lower-alpha 3][lower-alpha 4] | 26.5 | 27.5 | 8.5 | 5.5 | 12.0 | 4.0 | 6.5 | 9.5 | 1.0 | ||
| 9–14 Oct | Alco[lower-alpha 3] | 27.6 | 26.3 | 7.8 | 6.6 | 8.7 | 4.5 | 6.3 | 12.3 | 1.3 | ||
| 8–10 Oct | Rass[lower-alpha 3] | 31.0 | 29.3 | 6.4 | 6.2 | 8.1 | 3.9 | 6.7 | 8.5 | 1.7 | ||
| 3–7 Oct | GPO[lower-alpha 3] | 27.5 | 26.8 | 7.9 | 5.9 | 10.2 | 5.5 | 7.9 | 8.4 | 0.7 | ||
| 1–7 Oct | Marc[lower-alpha 3] | 28.6 | 28.3 | 6.6 | 6.5 | 8.9 | 5.8 | 6.2 | 9.1 | 0.3 | ||
| 28 Sep–4 Oct | Palmos Analysis | 27.8 | 30.0 | 6.9 | 6.3 | 9.7 | 4.5 | 6.2 | 8.8 | 2.2 | ||
| 1–3 Oct | MRB[lower-alpha 3] | 28.5 | 27.7 | 6.8 | 6.3 | 9.0 | 4.7 | 6.5 | 10.5 | 0.8 | ||
| 1–3 Oct | Alco[lower-alpha 3] | 29.5 | 28.3 | 8.0 | 6.5 | 8.3 | 5.0 | 6.1 | 8.4 | 1.2 | ||
| 25–30 Sep | VPRC | 29.0 | 29.5 | 7.0 | 6.0 | 8.5 | 4.0 | 7.5 | 8.5 | 0.5 | ||
| 25–26 Sep | Alco[lower-alpha 3] | 28.8 | 27.2 | 7.9 | 7.2 | 9.0 | 4.7 | 6.3 | 8.9 | 1.6 | ||
| 24–26 Sep | MRB | 29.0 | 27.5 | 7.2 | 6.9 | 8.9 | 4.3 | 6.5 | 9.7 | 1.5 | ||
| 20–23 Sep | Alco[lower-alpha 3] | 28.0 | 25.6 | 8.0 | 6.7 | 9.1 | 4.8 | 6.5 | 11.3 | 2.4 | ||
| 19–21 Sep | Rass[lower-alpha 3] | 32.7 | 29.2 | 6.8 | 5.5 | 7.5 | 3.2 | 7.3 | 7.8 | 3.5 | ||
| 17–19 Sep | Metron Analysis | 28.3 | 28.7 | 7.0 | 5.2 | 11.2 | 4.7 | 6.7 | 8.2 | 0.4 | ||
| 11–12 Sep | Metrisi[lower-alpha 3] | 27.5 | 26.9 | 7.0 | 6.6 | 14.0 | 2.9 | 6.8 | 8.3 | 0.6 | ||
| 10–12 Sep | Rass[lower-alpha 3] | 30.9 | 29.9 | 5.9 | 6.0 | 10.4 | 3.0 | 5.7 | 8.2 | 1.0 | ||
| 9–10 Sep | Pulse RC[lower-alpha 3][lower-alpha 4] | 24.5 | 26.0 | 9.0 | 5.0 | 17.0 | 4.0 | 6.5 | 8.0 | 1.5 | ||
| 5–10 Sep | Public Issue | 28.0 | 29.0 | 7.0 | 5.5 | 13.0 | 2.5 | 6.5 | 8.5 | 1.0 | ||
| 27–28 Aug | Metron Analysis | 29.1 | 29.0 | 6.8 | 5.1 | 11.7 | 3.1 | 6.9 | 8.3 | 0.1 | ||
| 17–18 Jul | Kapa Research[lower-alpha 3] | 28.9 | 28.4 | 9.1 | 5.6 | 12.1 | 3.5 | 6.1 | 6.3 | 0.5 | ||
| 11–13 Jul | Pulse RC[lower-alpha 3][lower-alpha 4] | 24.0 | 26.5 | 8.5 | 5.0 | 16.5 | 4.0 | 7.5 | 8.0 | 2.5 | ||
| 9–10 Jul | Metron Analysis | 29.1 | 28.7 | 7.3 | 5.4 | 13.1 | 3.2 | 5.5 | 7.7 | 0.4 | ||
| 3–8 Jul | Public Issue | 28.5 | 27.5 | 8.0 | 7.0 | 11.0 | 3.0 | 7.0 | 8.0 | 1.0 | ||
| 4–5 Jul | VPRC | 28.0 | 28.5 | 7.0 | 5.5 | 14.5 | 2.5 | 7.5 | 6.5 | 0.5 | ||
| 25–27 Jun | Alco[lower-alpha 3] | 27.2 | 25.3 | 8.4 | 6.0 | 14.0 | 3.9 | 5.8 | 9.4 | 1.9 | ||
| 25 Jun | MRB | 28.1 | 26.6 | 7.8 | 7.0 | 11.6 | 3.8 | 6.5 | 8.6 | 1.5 | ||
| 13–21 Jun | MRB | 27.5 | 27.1 | 6.5 | 6.7 | 12.7 | 4.5 | 6.8 | 8.2 | 0.4 | ||
| 18–20 Jun | Rass[lower-alpha 3] | 30.7 | 29.4 | 5.0 | 5.1 | 10.0 | 3.7 | 5.8 | 10.3 | 1.3 | ||
| 12–13 Jun | Metron Analysis | 28.2 | 27.9 | 6.5 | 6.3 | 11.4 | 6.4 | 5.0 | 8.3 | 0.3 | ||
| 12–13 Jun | Kapa Research[lower-alpha 3] | 27.4 | 27.0 | 8.1 | 5.6 | 12.1 | 5.0 | 6.5 | 8.3 | 0.4 | ||
| 11–13 Jun | VPRC | 26.5 | 29.0 | 7.0 | 6.0 | 14.0 | 4.5 | 7.0 | 6.0 | 2.5 | ||
| 6–11 Jun | Public Issue | 29.5 | 27.5 | 6.5 | 6.0 | 11.5 | 4.5 | 6.0 | 8.5 | 2.0 | ||
| 5–6 Jun | MRB | 27.9 | 25.6 | 6.4 | 6.9 | 13.4 | 6.2 | 5.8 | 7.8 | 2.3 | ||
| 30 May–4 Jun | Pulse RC[lower-alpha 3][lower-alpha 4] | 25.5 | 25.0 | 8.0 | 5.0 | 16.5 | 4.5 | 7.0 | 8.5 | 0.5 | ||
| 23–27 May | GPO[lower-alpha 3] | 26.2 | 24.0 | 8.2 | 7.9 | 12.4 | 6.3 | 7.1 | 7.9 | 2.2 | ||
| 22–24 May | Rass[lower-alpha 3] | 30.6 | 27.6 | 5.9 | 6.0 | 11.5 | 4.7 | 5.7 | 8.0 | 3.0 | ||
| 21–24 May | Alco[lower-alpha 3] | 27.7 | 24.6 | 6.4 | 5.8 | 12.2 | 4.6 | 5.7 | 13.0 | 3.1 | ||
| 10–15 May | Public Issue | 27.5 | 28.0 | 6.5 | 6.0 | 11.5 | 5.5 | 6.5 | 8.5 | 0.5 | ||
| 8–13 May | Marc | 27.3 | 26.1 | 6.0 | 7.1 | 11.8 | 5.0 | 5.7 | 11.0 | 1.2 | ||
| 18 Apr–12 May | AUEB[lower-alpha 3] | 25.1 | 24.9 | 7.3 | 4.9 | 14.4 | 5.9 | 7.2 | 10.3 | 0.2 | ||
| 23–26 Apr | Alco[lower-alpha 3] | 26.4 | 25.6 | 7.1 | 6.5 | 12.0 | 4.8 | 6.3 | 11.3 | 0.8 | ||
| 22–24 Apr | VPRC | 27.0 | 29.5 | 7.0 | 6.0 | 13.0 | 4.5 | 7.0 | 6.0 | 2.5 | ||
| 16–17 Apr | Metron Analysis | 27.0 | 26.2 | 8.0 | 9.5 | 10.7 | 5.6 | 5.5 | 7.5 | 0.8 | ||
| 11–13 Apr | Marc | 27.3 | 27.5 | 6.7 | 7.3 | 12.0 | 5.4 | 6.4 | 7.4 | 0.2 | ||
| 9 Apr | Pulse RC[lower-alpha 3][lower-alpha 4] | 25.5 | 26.0 | 9.0 | 6.5 | 15.5 | 4.5 | 6.5 | 6.5 | 0.5 | ||
| 5–9 Apr | Public Issue | 28.5 | 27.5 | 8.0 | 6.5 | 11.0 | 6.5 | 5.5 | 6.5 | 1.0 | ||
| 28 Mar–1 Apr | GPO[lower-alpha 3] | 25.9 | 25.9 | 9.6 | 8.0 | 11.5 | 6.4 | 7.4 | 5.3 | 0.0 | ||
| 28–29 Mar | Alco[lower-alpha 3] | 26.5 | 25.7 | 8.4 | 8.0 | 11.7 | 5.3 | 6.9 | 7.5 | 0.8 | ||
| 27–28 Mar | MRB | 27.5 | 27.0 | 6.9 | 7.7 | 11.3 | 6.8 | 5.8 | 7.0 | 0.5 | ||
| 26–28 Mar | Marc | 27.8 | 27.9 | 6.8 | 7.0 | 11.5 | 5.5 | 5.9 | 7.6 | 0.1 | ||
| 20–21 Mar | Kapa Research[lower-alpha 3] | 26.3 | 27.1 | 9.1 | 5.7 | 13.3 | 4.8 | 6.5 | 7.2 | 0.8 | ||
| 20–21 Mar | VPRC | 28.5 | 31.0 | 6.0 | 5.5 | 11.0 | 5.5 | 6.0 | 6.5 | 2.5 | ||
| 19–20 Mar | Metron Analysis | 25.2 | 25.8 | 9.0 | 8.5 | 11.7 | 6.3 | 5.5 | 8.1 | 0.6 | ||
| 15 Mar | Metrisi[lower-alpha 3] | 28.4 | 28.0 | 9.2 | 5.9 | 11.9 | 5.0 | 6.4 | 5.2 | 0.4 | ||
| 13–15 Mar | Marc | 27.4 | 28.4 | 6.8 | 6.6 | 11.7 | 5.7 | 5.3 | 8.1 | 1.0 | ||
| 8–12 Mar | Public Issue | 28.5 | 29.5 | 7.5 | 8.0 | 10.0 | 6.0 | 5.5 | 5.0 | 1.0 | ||
| 15–22 Feb | Marc | 28.0 | 28.3 | 6.6 | 6.6 | 12.3 | 5.4 | 5.5 | 7.3 | 0.3 | ||
| 15–19 Feb | Alco[lower-alpha 3] | 25.3 | 25.9 | 8.7 | 6.5 | 13.2 | 5.2 | 6.0 | 9.2 | 0.6 | ||
| 12–14 Feb | Metron Analysis | 26.4 | 27.6 | 7.5 | 6.2 | 11.5 | 5.6 | 6.4 | 8.9 | 1.2 | ||
| 12–13 Feb | Pulse RC[lower-alpha 3][lower-alpha 4] | 25.0 | 26.5 | 9.0 | 6.0 | 15.0 | 5.0 | 7.5 | 6.0 | 1.5 | ||
| 7–12 Feb | Alco[lower-alpha 3] | 27.5 | 26.2 | 9.4 | 6.5 | 12.2 | 5.2 | 6.2 | 6.8 | 1.3 | ||
| 1–5 Feb | Public Issue | 28.5 | 29.0 | 7.0 | 8.0 | 11.5 | 6.0 | 5.5 | 4.5 | 0.5 | ||
| 31 Jan–4 Feb | GPO[lower-alpha 3] | 27.0 | 26.6 | 9.5 | 6.6 | 12.8 | 6.1 | 6.4 | 5.0 | 0.4 | ||
| 24 Jan | Pulse RC[lower-alpha 3][lower-alpha 4] | 25.0 | 27.0 | 8.5 | 6.0 | 15.0 | 5.0 | 6.0 | 7.5 | 2.0 | ||
| 22–24 Jan | Rass[lower-alpha 3] | 29.9 | 29.5 | 6.2 | 5.6 | 10.3 | 6.1 | 5.9 | 6.5 | 0.4 | ||
| 22–24 Jan | Alco[lower-alpha 3] | 28.1 | 26.4 | 9.7 | 7.4 | 10.9 | 5.4 | 5.9 | 6.2 | 1.7 | ||
| 22–24 Jan | MRB | 29.2 | 27.8 | 7.0 | 6.2 | 11.6 | 5.6 | 5.4 | 7.2 | 1.4 | ||
| 22–24 Jan | Kapa Research[lower-alpha 3] | 27.6 | 25.5 | 8.7 | 5.5 | 12.6 | 5.8 | 6.6 | 7.7 | 2.1 | ||
| 18–21 Jan | Marc | 28.2 | 27.9 | 7.2 | 7.0 | 12.2 | 5.8 | 5.3 | 6.4 | 0.3 | ||
| 17–18 Jan | VPRC | 29.5 | 29.5 | 6.5 | 6.0 | 12.0 | 5.0 | 5.5 | 6.0 | 0.0 | ||
| 15–17 Jan | Metron Analysis | 27.8 | 28.0 | 7.7 | 6.3 | 10.7 | 5.7 | 5.4 | 8.4 | 0.2 | ||
| 4–8 Jan | Public Issue | 29.0 | 28.5 | 8.0 | 8.0 | 10.0 | 7.0 | 5.5 | 4.0 | 0.5 | ||
| 2013 | ||||||||||||
| 20–21 Dec | Kapa Research[lower-alpha 3] | 25.9 | 27.2 | 7.5 | 4.6 | 11.8 | 6.0 | 6.3 | Did not exist | Did not exist | 10.7 | 1.3 |
| 18–20 Dec | Rass[lower-alpha 3] | 29.5 | 30.3 | 6.8 | 3.3 | 10.8 | 5.9 | 5.7 | 7.7 | 0.8 | ||
| 19 Dec | Marc | 27.0 | 28.5 | 7.0 | 6.8 | 12.1 | 5.6 | 5.9 | 7.1 | 1.5 | ||
| 11–14 Dec | Alco[lower-alpha 3] | 26.9 | 28.9 | 6.9 | 5.9 | 13.3 | 5.3 | 5.6 | 7.2 | 2.0 | ||
| 6–10 Dec | Public Issue | 26.0 | 30.5 | 8.0 | 9.0 | 10.5 | 6.5 | 5.5 | 4.0 | 4.5 | ||
| 27 Nov–6 Dec | MRB | 26.1 | 28.7 | 7.8 | 7.1 | 12.1 | 5.7 | 5.4 | 7.1 | 2.6 | ||
| 15 Nov–3 Dec | Metron Analysis | 26.5 | 29.5 | 6.7 | 8.0 | 12.0 | 6.0 | 5.5 | 5.7 | 3.0 | ||
| 23–26 Nov | Marc | 26.2 | 29.0 | 6.4 | 7.1 | 12.4 | 6.1 | 5.7 | 7.1 | 2.8 | ||
| 23–26 Nov | VPRC | 26.5 | 31.5 | 5.0 | 6.5 | 12.5 | 5.5 | 6.5 | 6.0 | 5.0 | ||
| 22–23 Nov | Pulse RC[lower-alpha 3][lower-alpha 4] | 23.5 | 29.0 | 7.5 | 8.0 | 15.0 | 4.5 | 6.0 | 6.5 | 5.5 | ||
| 15–17 Nov | GPO[lower-alpha 3] | 24.9 | 27.6 | 9.3 | 8.1 | 12.8 | 6.2 | 5.7 | 5.4 | 2.7 | ||
| 8 Nov | Kapa Research[lower-alpha 3] | 23.9 | 27.1 | 8.8 | 7.5 | 12.2 | 5.4 | 6.7 | 8.4 | 3.2 | ||
| 23–30 Oct | Pulse RC[lower-alpha 3][lower-alpha 4] | 24.5 | 28.0 | 8.0 | 8.0 | 14.0 | 5.0 | 6.0 | 6.5 | 3.5 | ||
| 23 Oct | Marc | 26.4 | 28.8 | 7.5 | 6.9 | 11.8 | 6.1 | 5.9 | 6.6 | 2.4 | ||
| 16–17 Oct | VPRC | 27.0 | 30.5 | 5.5 | 7.0 | 14.0 | 5.5 | 6.5 | 4.0 | 3.5 | ||
| 15–17 Oct | Rass[lower-alpha 3] | 26.6 | 27.9 | 8.4 | 7.2 | 10.8 | 5.9 | 5.3 | 7.9 | 1.3 | ||
| 18–20 Sep | MRB | 29.0 | 28.0 | 10.0 | 6.0 | 11.0 | 5.0 | 5.0 | 6.0 | 1.0 | ||
| 17–20 Sep | Rass[lower-alpha 3] | 28.0 | 26.7 | 9.5 | 7.3 | 10.8 | 6.0 | 5.3 | 6.4 | 1.3 | ||
| 18–19 Sep | Metron Analysis | 26.1 | 27.7 | 9.8 | 7.2 | 11.7 | 6.4 | 5.1 | 5.9 | 1.6 | ||
| 4–5 Sep | VPRC | 28.0 | 30.0 | 7.5 | 7.0 | 12.0 | 4.0 | 6.0 | 5.5 | 2.0 | ||
| 31 Aug–4 Sep | Pulse RC[lower-alpha 3][lower-alpha 4] | 27.5 | 26.5 | 9.0 | 7.0 | 11.5 | 5.0 | 5.5 | 8.0 | 1.0 | ||
| 29–31 Aug | Alco[lower-alpha 3] | 27.8 | 25.6 | 10.3 | 7.6 | 9.7 | 5.8 | 5.3 | 7.9 | 2.2 | ||
| 24–25 Jul | VPRC[lower-alpha 3][lower-alpha 4] | 28.0 | 28.5 | 9.5 | 8.5 | 8.0 | 7.0 | 6.0 | 4.5 | 0.5 | ||
| 11–12 Jul | Kapa Research[lower-alpha 3] | 27.8 | 24.4 | 13.1 | 7.5 | 8.7 | 6.7 | 5.6 | 6.2 | 3.4 | ||
| 10–12 Jul | MRB | 28.9 | 26.7 | 12.3 | 7.7 | 7.5 | 6.3 | 5.1 | 5.5 | 2.2 | ||
| 17 Jun 2012 | Legislative Election | 29.7 | 26.9 | 12.3 | 7.5 | 6.9 | 6.2 | 4.5 | 6.0 | 2.8 | ||
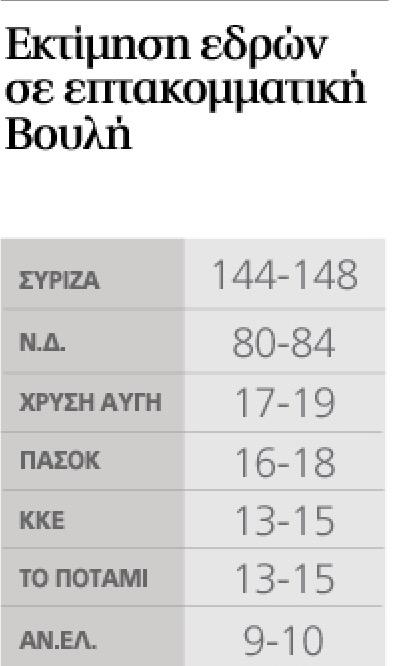
Seat projections
Opinion polls showing seat projections are displayed in the table below. The highest seat figures in each polling survey have their background shaded in the leading party's colour. In the instance that there is a tie, then no figure is shaded. 151 seats are required for an absolute majority in the Hellenic Parliament. 50 additional seats are awarded as a majority bonus to the single party winning the largest share of the votes.
| Date | Polling Firm/Source | ND | SYRIZA | PASOK | ANEL | XA | DIMAR | KKE | Potami | KIDISO | Others |
|---|---|---|---|---|---|---|---|---|---|---|---|
| 25 Jan 2015 | Legislative Election | 76 | 149 | 13 | 13 | 17 | 0 | 15 | 17 | 0 | 0 |
| 25 Jan (21:30) | Singular Logic | 76 | 150 | 13 | 13 | 17 | 0 | 15 | 16 | 0 | 0 |
| 25 Jan (20:45) | Public Issue | 76 | 150 | 13 | 13 | 17 | 0 | 15 | 16 | 0 | 0 |
| 25 Jan (19:00) | Interview | 72 | 145 | 10 | 12 | 15 | 0 | 12 | 19 | 0 | 0 |
| 25 Jan (19:00) | Palmos Analysis | 71 | 155 | 11 | 12 | 18 | 0 | 15 | 18 | 0 | 0 |
| 25 Jan (19:00) | Joint exit poll[lower-alpha 2] | 65−75 | 146−158 | 12−15 | 10−13 | 17−22 | 0 | 13−16 | 17−22 | 0−8 | 0 |
| 25 Jan (19:00) | Kapa Research | 70−78 | 148−154 | 12−14 | 10−12 | 16−20 | 0 | 15−17 | 16−19 | 0−8 | 0 |
| Exit polls | |||||||||||
| 23 Jan | Metron Analysis | 81 | 149 | 12 | 9 | 16 | 0 | 14 | 19 | 0 | 0 |
| 21–23 Jan | Palmos Analysis | 71 | 150 | 12 | 11 | 19 | 0 | 16 | 21 | 0 | 0 |
| 20–23 Jan | Public Issue | 78 | 145 | 14 | 9 | 18 | 0 | 16 | 20 | 0 | 0 |
| 19–22 Jan | Palmos Analysis | 72 | 149 | 12 | 10 | 21 | 0 | 15 | 21 | 0 | 0 |
| 19–21 Jan | Metron Analysis | 83 | 147 | 11 | 11 | 15 | 0 | 13 | 20 | 0 | 0 |
| 19–20 Jan | Pulse RC | 80 | 144 | 16 | 9 | 17 | 0 | 15 | 19 | 0 | 0 |
| 15–17 Jan | Alco | 86 | 147 | 13 | 10 | 15 | 0 | 13 | 16 | 0 | 0 |
| 16 Jan | Metron Analysis | 85 | 147 | 12 | 8 | 15 | 0 | 14 | 19 | 0 | 0 |
| 12–15 Jan | Palmos Analysis | 79 | 144 | 11 | 8 | 18 | 0 | 15 | 25 | 0 | 0 |
| 10–15 Jan | Public Issue | 81 | 144 | 13 | 8 | 17 | 0 | 18 | 19 | 0 | 0 |
| 13–14 Jan | Pulse RC | 81 | 142 | 17 | 9 | 17 | 0 | 15 | 19 | 0 | 0 |
| 5–14 Jan | E.Panas | 79 | 143 | 18 | 10 | 15 | 0 | 16 | 19 | 0 | 0 |
| 2–9 Jan | Public Issue | 80 | 151 | 15 | 8 | 15 | 0 | 13 | 18 | 0 | 0 |
| 5–8 Jan | MRB | 83 | 143 | 15 | 9 | 15 | 0 | 16 | 19 | 0 | 0 |
| 5–8 Jan | Metron Analysis | 82 | 144 | 11 | 10 | 15 | 0 | 15 | 23 | 0 | 0 |
| 5–8 Jan | Palmos Analysis | 79 | 146 | 10 | 8 | 21 | 0 | 15 | 21 | 0 | 0 |
| 5–6 Jan | Pulse RC | 80 | 141 | 18 | 9 | 18 | 0 | 16 | 18 | 0 | 0 |
| 30 Dec–3 Jan | Palmos Analysis | 78 | 149 | 11 | 11 | 18 | 0 | 15 | 18 | 0 | |
| 2015 | |||||||||||
| 26–28 Dec | Palmos Analysis | 78 | 144 | 12 | 9 | 19 | 0 | 13 | 25 | Did not exist | 0 |
| 19–22 Dec | Palmos Analysis | 77 | 141 | 14 | 13 | 17 | 0 | 17 | 21 | 0 | |
| 18–22 Dec | Alco[lower-alpha 3] | 83 | 144 | 16 | 10 | 18 | 0 | 14 | 15 | 0 | |
| 19–21 Dec | Pulse RC | 78 | 140 | 20 | 10 | 18 | 0 | 16 | 18 | 0 | |
| 14–16 Dec | Palmos Analysis | 75 | 146 | 12 | 14 | 18 | 0 | 17 | 18 | 0 | |
| 13 Dec | Alco | 80−84 | 144−148 | 16−18 | 9−10 | 17−19 | 0 | 13−15 | 13−15 | 0 | |
| 12–13 Dec | Pulse RC | 77 | 138 | 22 | 10 | 19 | 0 | 16 | 18 | 0 | |
| 10–13 Dec | MRB | 77 | 138 | 20 | 10 | 16 | 0 | 18 | 21 | 0 | |
| 8–10 Dec | Metron Analysis | 79 | 140 | 16 | 10 | 15 | 0 | 15 | 25 | 0 | |
| 1–3 Dec | Metron Analysis | 75 | 141 | 14 | 10 | 19 | 0 | 15 | 26 | 0 | |
| 24–27 Nov | Palmos Analysis | 64 | 147 | 14 | 13 | 22 | 0 | 18 | 22 | 0 | |
| 24–26 Nov | Metron Analysis | 77 | 140 | 17 | 10 | 17 | 0 | 18 | 21 | 0 | |
| 17–19 Nov | Metron Analysis | 75 | 143 | 15 | 11 | 14 | 0 | 18 | 24 | 0 | |
| 10–12 Nov | Metron Analysis | 75 | 138 | 15 | 11 | 16 | 0 | 17 | 28 | 0 | |
| 3–5 Nov | Metron Analysis | 73 | 140 | 14 | 13 | 16 | 0 | 15 | 29 | 0 | |
| 13–20 Oct | Public Issue | 71 | 144 | 16 | 8 | 16 | 0 | 17 | 28 | 0 | |
| 13–15 Oct | Metron Analysis | 73 | 141 | 13 | 13 | 17 | 0 | 19 | 24 | 0 | |
| 6–8 Oct | Metron Analysis | 73 | 145 | 13 | 9 | 20 | 0 | 15 | 25 | 0 | |
| 4–8 Oct | Palmos Analysis | 71 | 150 | 18 | 9 | 17 | 0 | 14 | 21 | 0 | |
| 27 Sep–4 Oct | UoA | 64 | 143 | 19 | 9 | 28 | 0 | 17 | 20 | 0 | |
| 15–23 Sep | Public Issue | 61−72 | 142−150 | 12−17 | 8−13 | 16−24 | 0 | 15−20 | 20−30 | 0 | |
| 18–19 Sep | Rass | 76 | 140 | 15 | 11 | 23 | 0 | 19 | 16 | 0 | |
| 16–18 Sep | MRB | 73 | 136 | 15 | 12 | 25 | 0 | 19 | 20 | 0 | |
| 16–18 Sep | Alco | 79 | 142 | 15 | 11 | 22 | 0 | 16 | 15 | 0 | |
| 11–15 Sep | PAMAK | 66 | 139 | 20 | 11 | 24 | 0 | 20 | 20 | 0 | |
| 25 May 2014 | EP Election | (69) | (130) | (24) | (11) | (28) | (0) | (18) | (20) | (0) | |
| 2014 | |||||||||||
| 2013 | |||||||||||
| 17 Jun 2012 | Legislative Election | 129 | 71 | 33 | 20 | 18 | 17 | 12 | 0 | ||
Notes
- 1 2 3 4 5 6 7 8 9 This poll provides data ranges and/or approximations. In order to simplify, the average of these data is given.
- 1 2 3 Joint exit poll conducted by Alco, GPO, Marc, Metron Analysis and MRB.
- 1 2 3 4 5 6 7 8 9 10 11 12 13 14 15 16 17 18 19 20 21 22 23 24 25 26 27 28 29 30 31 32 33 34 35 36 37 38 39 40 41 42 43 44 45 46 47 48 49 50 51 52 53 54 55 56 57 58 59 60 61 62 63 64 65 66 67 68 69 70 71 72 73 74 75 76 77 78 79 80 81 82 83 84 85 86 87 88 89 90 91 92 93 94 95 96 97 98 99 100 101 102 103 104 105 106 107 108 109 110 111 112 113 114 115 116 117 118 119 120 121 122 123 124 125 126 127 128 129 130 131 132 133 134 135 136 137 138 139 140 141 142 143 144 145 146 147 148 149 150 151 152 153 154 155 156 157 158 159 160 161 162 163 164 165 166 167 The linked core data of this poll, shows the percentage of support each party would gain among the surveyed sample of the electorate, without disregarding those who were undecided or said they would abstain from voting (either physically or by voting blank). However, in order to obtain results comparable to other polls and the official election results, the result shown in this table has been adjusted based on the simple rule of three, which mean the "group of undecided and/or abstaining voters" have been assumed ultimately to cast their votes (if any) according to the exact same distribution as the group of decided voters (having cast a specific vote in the survey). Or in other words, they are simply disregarded under the assumption they will not cause any change to the already found distribution of votes. After this calculated adjustment, the total of all noted vote shares in the table equals 100%, which is similar to how the results of the official elections are presented. This practice is done for most pollsters, as most of them use and/or have used this system in the past in order to show results comparable to other polls and election results. Exceptionally, Palmos Analysis polls are verified to use a different system than this one, and as such it should not be applied to them.
- 1 2 3 4 5 6 7 8 9 10 11 12 13 14 15 16 17 18 19 20 21 22 23 24 25 26 27 28 29 30 31 32 33 34 35 36 37 38 39 40 Pulse RC, VPRC, PAMAK and ProRata opinion polls round their data so that in the end they show a .0 or a .5 value. This practise is maintained for these polls when disregarding undecided and/or abstaining voters from the totals so as to avoid different interpretations of the same value.